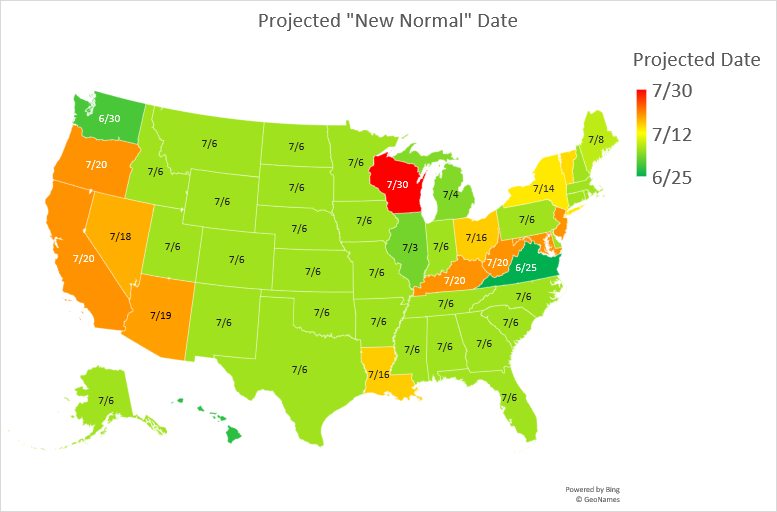
Through rigorous analysis of data, they’ve put together projections of when different states could be back to normal, or at least a “new normal.” We’re calling these milestone dates the “Projected Business as Usual Date.” This will be a projection we model and update weekly based on the latest data coming in from individual U.S. states and calibrated against what we are seeing in the rest of the world.
These dates should be read as “on or after” dates. Our models project that these are the earliest dates for a return to normalcy in each state. The exact definition of normalcy will vary across the country, but generally it will mean that:
- People are back to work and are moving/traveling locally without large-scale restriction.
- Non-essential businesses are operating.

The output of this model is based largely on calculations of the virus’s state-by-state growth rate. There is a host of new terminology and underlying data fed into these projections. We will heavily caveat that this a theoretical model that will change as more data becomes available. We also anticipate that different courses for government intervention and the behavior of localized populations will impact the projections.
Here is the methodology behind these projections: The primary driver of the projected normalcy dates is the ongoing growth rate in new cases. As we all know, slowing or eliminating the spread of this virus is the only way we’ll truly be able to return to business as usual. The growth rate can be defined simply as new cases today divided by total cases. If the rate of growth in new cases is slowing or, ideally, declining, we can generally assume that a state is on the path to moderating and eventually containing the outbreak. Our projections utilize established scientific milestones in epidemic mitigation while incorporating all available examples of government/business action and consumer behavior. As stated above, these estimates are theoretical and could evolve significantly as new data becomes available.


